TimTaiLieu.vn - Tài liệu, ebook, giáo trình, đồ án, luận văn
Tổng hợp tất cả tài liệu, ebook, giáo trình Giải Tích - Đại Số chọn lọc và hay nhất.

 Bài giảng Quy hoạch thực nghiệm - Chương 3: Phân tích biến lượng
3.1. Mục tiêu của ANOVA ANOVA nghiên cứu ảnh hưởng của các yếu tố đến sự thay đổi giá trị của đáp ứng qua việc đánh giá sự thay đổi của giá trị trung bình của chúng ANOVA sử dụng tính cộng của biến lượng của các biến ngẩu nhiên ANOVA là một công cụ rất mạnh khi khảo sát nhiều yếu tố đồng thời (phù hợp với qui hoạch thực nghiệm) Cơ s...
 61 trang | Chia sẻ: thanhle95 | Ngày: 15/07/2021 | Lượt xem: 635 | Lượt tải: 1
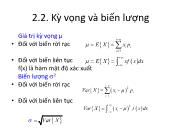 Bài giảng Quy hoạch thực nghiệm - Chương 2b: Kỳ vọng và biến lượng
2.3. Hệ số tin cậy và mức ý nghĩa • Hệ số tin cậy là xác xuất để khoảng tin cậy chứa giá trị thực của một thông số của không gian mẫu. Hệ số tin cậy còn được gọi là mức tin cậy • Mức ý nghĩa, được dùng trong kiểm định giả thuyết, là xác xuất mà ta loại bỏ một giả thuyết đúng hay phần trăm rủi ro khi ta loại bỏ giả thuyết khi giả thuyết đó ...
 24 trang | Chia sẻ: thanhle95 | Ngày: 15/07/2021 | Lượt xem: 540 | Lượt tải: 0
 Bài giảng Quy hoạch thực nghiệm - Chương 2: Khái niệm thống kê
Hàm phân bố t Khác với hàm phân bố chuẩn Gauss, hàm phân bố t ngoài đặc trưng thống kê và , còn có độ tự do – df Để ước tính giá trị trung bình của không gian mẫu, độ tự do bằng N – 1. N là độ lớn của mẫu Ở độ tự do thấp, hàm phân bố t phân tán hơn hàm phân bố Gauss – nghĩa là với độ tin cậy 95% khoảng tin cậy sẽ rộng hơn Khi độ ...
 26 trang | Chia sẻ: thanhle95 | Ngày: 15/07/2021 | Lượt xem: 606 | Lượt tải: 0
 Bài giảng Quy hoạch thực nghiệm - Chương 1: Khái niệm qui hoạch thực nghiệm
1.1. Khái niệm chung Thực nghiệm là một quá trình hoặc một nghiên cứu mà kết quả là thu được các số liệu, thông tin. Các kết quả này trước đó chưa biết. Thường về mặt thống kê, các thực nghiệm được tiến hành trong các điều kiện mà nhà nghiên cứu có thể quản lý và kiểm soát được các yếu tố không liên quan đến mục tiêu nghiên cứu. Qui hoạc...
 48 trang | Chia sẻ: thanhle95 | Ngày: 15/07/2021 | Lượt xem: 1318 | Lượt tải: 0
 Bài giảng Probability & Statistics - Lecture 10: Two populations testing - Bùi Dương Hải
Example Example 10.1. The survey of 100 customers, in which 40 are male and 60 are female, shows that: for the male, average consumption is $250, standard deviation is $11; for the female, average consumption is $256, standard deviation is 15. Assumed that consumption of both are normal distributed. (a) With significant level of 5%, test th...
 9 trang | Chia sẻ: thanhle95 | Ngày: 15/07/2021 | Lượt xem: 530 | Lượt tải: 0
 Bài giảng Probability & Statistics - Lecture 9: Hypothesis testing - Bùi Dương Hải
Example Example 9.2. In the past, average productivity of worker is 120. To improve productivity, new management procedure is applied. Recently survey of 25 workers shows sample mean is 126.2, sample variance is 225. Assumed that productivity is Normality, (a) Test the hypothesis that average productivity has increased, at significant le...
 19 trang | Chia sẻ: thanhle95 | Ngày: 15/07/2021 | Lượt xem: 577 | Lượt tải: 0
 Bài giảng Probability & Statistics - Lecture 8: Estimation - Bùi Dương Hải
8.1. Concept of Estimate Estimation is determining the approximate value of a unknown parameter on given data. Two types of estimate: Point estimate: single value Interval estimate: an interval that parameter falls into it with a determined probability level Ex. “The average height of VN’s male is 163 cm” “The average height of VN’s...
 20 trang | Chia sẻ: thanhle95 | Ngày: 15/07/2021 | Lượt xem: 572 | Lượt tải: 0
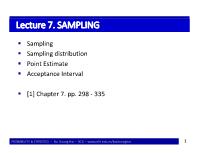 Bài giảng Probability & Statistics - Lecture 7: Sampling - Bùi Dương Hải
7.2. Sampling Distribution A sampling distribution is a distribution of all of the possible values of a statistic for a given sample selected from a population Distribution of Sample Mean Distribution of Sample Proportion Distribution of Sample Variance
 18 trang | Chia sẻ: thanhle95 | Ngày: 15/07/2021 | Lượt xem: 851 | Lượt tải: 0
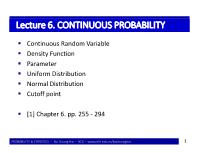 Bài giảng Probability & Statistics - Lecture 6: Continuous probability - Bùi Dương Hải
Example Example 6.2. Return ($mil) of project A is normality with mean of 8 and variance of 9. Calculate the probability: (a) Return of A higher than 10 (b) Loss money (c) Return of A between 5 and 12 Return of project B is normality with mean of 10 and variance of 25. A and B are independent. Calculate the probability that: (c) Both gai...
 19 trang | Chia sẻ: thanhle95 | Ngày: 15/07/2021 | Lượt xem: 588 | Lượt tải: 0
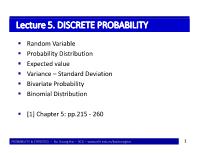 Bài giảng Probability & Statistics - Lecture 5: Discrete probability - Bùi Dương Hải
Example Example 5.6. The quiz includes 10 multiple choices questions, each has 4 options and only one correct. A candidate do all questions by random choose the answers. (a) Expectation and variance of number of correct answer? (b) Probability that there are 3 correct answers? (c) Probability that there are at least 6 correct ones? (d) Eac...
 21 trang | Chia sẻ: thanhle95 | Ngày: 15/07/2021 | Lượt xem: 780 | Lượt tải: 0
Website đang trong thời gian thử nghiệm, chờ xin giấy phép của Bộ TT & TT.

