TimTaiLieu.vn - Tài liệu, ebook, giáo trình, đồ án, luận văn
Tổng hợp tất cả tài liệu, ebook, giáo trình Các Môn Đại Cương chọn lọc và hay nhất.

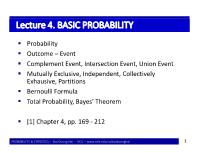 Bài giảng Probability & Statistics - Lecture 4: Basic probability - Bùi Dương Hải
Classical Probability Example 4.3: Flip a coin three times, what is the probability of (a) There are 2 Heads only? (b) There are Heads only? (c) There are 2 Heads, given the first is Head? (d) There are 2 Heads, given the first is Tail? Example 4.4 There is a box contains 6 white balls and 4 black balls. Random pick up 2 balls, calculate the...
 40 trang | Chia sẻ: thanhle95 | Ngày: 15/07/2021 | Lượt xem: 726 | Lượt tải: 0
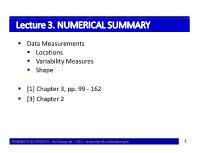 Bài giảng Probability & Statistics - Lecture 3: Numerical summary - Bùi Dương Hải
Data Measurements Location: Minimum, Maximum Central Tendency: Mean, Median, Mode Quantile: Quartile, Percentile Variability: Range Variance (Var) Standard Deviation (SD) Coefficient of Variation (CV) Interquartile Range (IQR)
40 trang | Chia sẻ: thanhle95 | Ngày: 15/07/2021 | Lượt xem: 624 | Lượt tải: 0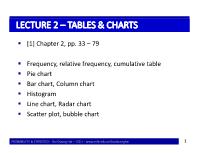 Bài giảng Probability & Statistics - Lecture 2: Tables & Charts - Bùi Dương Hải
LECTURE 2 – TABLES & CHARTS [1] Chapter 2, pp. 33 – 79 Frequency, relative frequency, cumulative table Pie chart Bar chart, Column chart Histogram Line chart, Radar chart Scatter plot, bubble chart
24 trang | Chia sẻ: thanhle95 | Ngày: 15/07/2021 | Lượt xem: 636 | Lượt tải: 0 Bài giảng Probability & Statistics - Lecture 1 - Bùi Dương Hải
Statistics is the fact ? Yes, but No ! Information for Statistics Statistics maybe biased Without testing for correction of statistics, decision would be wrong Statistics problem: Accuracy of data? Appropriate method? Studying capacity of classes? Compare popularity of two topics / trade marks / artists? Evaluate inv...
21 trang | Chia sẻ: thanhle95 | Ngày: 15/07/2021 | Lượt xem: 755 | Lượt tải: 0 Posterior summary of bayes error using monte-carlo sampling and its application in credit scoring
Abstract Bayesian classifier is one of the data classification methods that are of interest. In the Bayesian classifier, Bayes error, P e is an important measure because it can estimate the error of the model built through the calculation of the posterior probability function’s overlapping area. The exact calculation of P e depends on the exa...
10 trang | Chia sẻ: thanhle95 | Ngày: 15/07/2021 | Lượt xem: 678 | Lượt tải: 0 Bài giảng Phương pháp tính - Chương 5: Phương trình vi phân - Nguyễn Hồng Lộc
• Các phương pháp tìm nghiệm gần đúng của phương trình vi phân thường đòi hỏi các điều kiện được cho tại một thời điểm ban đầu nào đó. Dối với phương trình vi phân bậc hai, ta cần 2 giá trị y(xo) và y(xo). Tuy nhiên, nhiều bài toán trong thực tế cho thấy điều kiện của hàm. cần tìm được cho tại nhiều thời điểm khác nhau. Vấn đề này dẫn tới việc ...
29 trang | Chia sẻ: thanhle95 | Ngày: 15/07/2021 | Lượt xem: 669 | Lượt tải: 0 Bài giảng Phương pháp tính - Chương 4: Đạo hàm và tích phân - Nguyễn Hồng Lộc
Nhưng thường thì ta phải tính tích phân của hàm số y = f(x) được xác định bằng bảng số. Khi đó khái niệm nguyên hàm không còn ý nghĩa. Để tích gần đúng tích phân xác định trên [a, b], ta thay hàm số f(x) bằng đa thức nội suy Ph(x) và xem
18 trang | Chia sẻ: thanhle95 | Ngày: 15/07/2021 | Lượt xem: 736 | Lượt tải: 0 Bài giảng Phương pháp tính - Chương 3: Nội suy và xấp xỉ hàm - Nguyễn Hồng Lộc
Việc xây dựng một đa thức đi qua các điểm nội suy cho trước trong trường hợp n lớn là rất khó khăn và khó ứng dụng. Một trong những cách khắc phục là trên từng đoạn liên tiếp của các nút nội suy ta xây dựng những đa thức bậc thấp, đa thức đơn giản nhất là bậc 1,tuy nhiên khi nối các đa thức bậc 1 lại với nhau thì đồ thị tổng quát lại mất tính khả v...
35 trang | Chia sẻ: thanhle95 | Ngày: 15/07/2021 | Lượt xem: 605 | Lượt tải: 0 Bài giảng Phương pháp tính - Chương 2: Hệ phương trình tuyến tính - Nguyễn Hồng Lộc
o Viết ma trận mở rộng AB = (AB) của hệ (1). o Dùng các phép biến đổi Sơ cấp trên hàng biến đổi ma trận mở rộng về ma trận bậc thang. o Viết hệ phương trình tương ứng với ma trận bậc thang. o Ta giải hệ phương trình ngược từ dưới lên, tìm biến X, sau đó xn-1,., Xì ta được 1 nghiệm duy nhất.
78 trang | Chia sẻ: thanhle95 | Ngày: 15/07/2021 | Lượt xem: 677 | Lượt tải: 0 Bài giảng Phương pháp tính - Chương 1: Phương trình phi tuyến - Nguyễn Hồng Lộc
Định nghĩa Khoảng đóng [a, b] (hoặc khoảng mở (a, b)) mà trên đó tồn tại duy nhất 1 nghiệm của phương trình (1) được gọi là khoảng cách ly nghiệm. Việc tính nghiệm thực gần đúng của phương trình (1) được tiến hành theo 2 bước sau: o Tìm tất cả các khoảng cách ly nghiệm của phương trình (1). - Trong từng khoảng cách ly nghiệm, tìm nghiệm gần đún...
79 trang | Chia sẻ: thanhle95 | Ngày: 15/07/2021 | Lượt xem: 647 | Lượt tải: 0

